The results of the survey are presented in the form of contour maps and in
addition a list of compact sources is given, following the presentation of the
first survey section in Paper I. As described in Paper I we have decomposed
the survey maps into a "source component" and a "diffuse component". The sum
of both components gives the measured absolute temperature for any position.
Figure 3 (click here) shows the "source component" in Galactic
coordinates with a 2![]() grid of equatorial coordinates (Epoch 1950.0)
grid of equatorial coordinates (Epoch 1950.0)
superposed. The following contour intervals are shown:
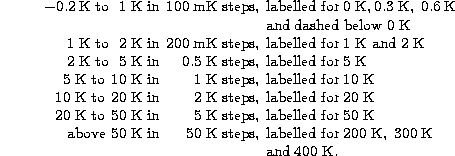
Figure 4 (click here) shows the "diffuse component" for the same fields as Fig. 3 (click here), but equatorial coordinates are shown for Epoch 2000.0. These intensities include the all-sky background temperature of 2.8 K. Contours are shown every 50 mK and are labelled every 250 mK.
A list of small diameter sources was derived by fitting a single elliptical
or a circular Gaussian in small area around individual sources. Only sources with
fitted flux densities exceeding 160 mK TB (or 79 mJy/beam) and
sizes smaller
than 16![]() have been included. We have calculated an integrated flux density
for all sources based on the peak flux density and the fitted size.
The list of 1830 compact sources is available in electronic form at the CDS
(anonymous ftp 130.79.128.5). The list is merged with that of Paper I (see
description of individual columns), where 884 sources have been fitted
with peak flux densities exceeding 98 mJy or 200 mK TB. Because of
residual sidelobes near to CAS A we have not tried to fit sources within the
area
have been included. We have calculated an integrated flux density
for all sources based on the peak flux density and the fitted size.
The list of 1830 compact sources is available in electronic form at the CDS
(anonymous ftp 130.79.128.5). The list is merged with that of Paper I (see
description of individual columns), where 884 sources have been fitted
with peak flux densities exceeding 98 mJy or 200 mK TB. Because of
residual sidelobes near to CAS A we have not tried to fit sources within the
area ![]() and
and ![]() . CAS A itself is so strong that nonlinearities of the
receiver make a flux determination unreliable.
. CAS A itself is so strong that nonlinearities of the
receiver make a flux determination unreliable.