It has been noted that in many cases, our sample of 1.5 Å\
spectra of sdB4 stars shows HeII![]() 4686Å stronger than was
expected from the definition of the class given by
Green
et al. (1986). As an extreme case, PG1600+171 and PG1441+407
show HeII
4686Å stronger than was
expected from the definition of the class given by
Green
et al. (1986). As an extreme case, PG1600+171 and PG1441+407
show HeII![]() 4686Å stronger than HeII
4686Å stronger than HeII![]() 4471Å.
At the other extreme, only two objects, PG1544+488 and
PG1415+492, show HeII
4471Å.
At the other extreme, only two objects, PG1544+488 and
PG1415+492, show HeII![]() 4686Å weaker than HeII
4686Å weaker than HeII![]() 4713Å.
4713Å.
Since the 10 Å classification spectra were obtained at lower resolution and signal-to-noise than the present observations, the reasons for the wide spread in apparent HeII/HeI ratios for a group of stars in the same 10 Å class can be appreciated. This would have been compounded by random errors introduced when classifying individual spectra. However, it is a fundamental principle of the classification process that standard spectra obtained at one resolution cannot be used to classify spectra obtained at a higher resolution. The MK process allows for the development of a sophisticated and autonomous classification system using, initially, line ratios and, ultimately, the entire spectrum. Since it can be refined to allow great precision in the description of stellar spectra and to select candidates for detailed study (Morgan 1984), it is both necessary and desirable to set up a system of standard classification spectra for high S/N spectra of 1.5 Å resolution. We have shown that this is eminently true from the point of view of our sample. In the remainder of this paper a suitable system is introduced.

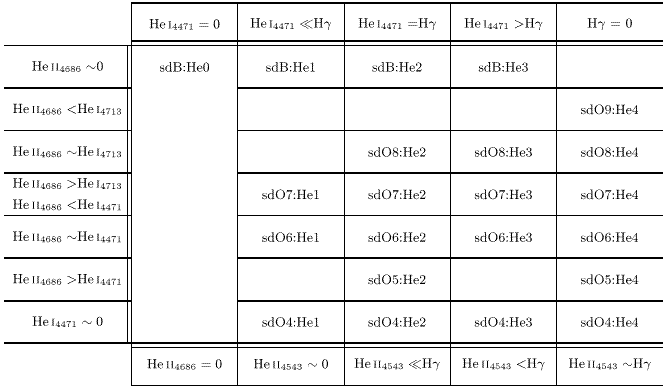
Figure 2: Schematic of 1.5 Å line-ratio
classification of hot subwarfs.
Only classes currently identifed from observation are labelled

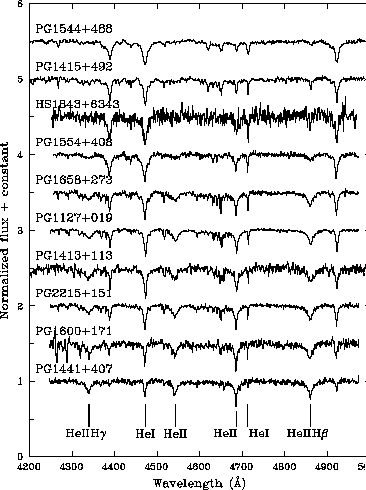
Figure 3: Comparison of the spectra of helium-rich
subluminous
stars in which hydrogen lines are not detected. The objects
are arranged in sequence of increasing HeII/HeI
ratio (top-to-bottom). The positions of the classification lines
are indicated. Lines at the positions of H![]() and H
and H![]() are inferred to be dominated by the Brackett series of HeII
by comparison with the intervening series member, HeII
are inferred to be dominated by the Brackett series of HeII
by comparison with the intervening series member, HeII![]() 4543Å
4543Å

Figure 4: Comparison of the spectra of helium-rich
subluminous
stars with a roughy equal HeII/HeI ratio. The objects
are arranged in sequence of increasing He/H
ratio (top-to-bottom). The positions of the classification lines
are indicated

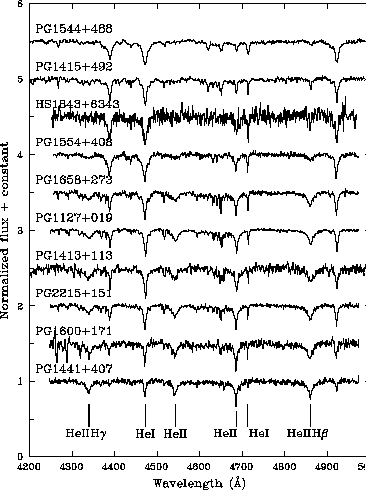
Figure 5: Comparison of the spectra of helium-rich
subluminous
stars in which hydrogen-lines are very weak or not detected
and HeII![]() 4686Å
is weaker than HeI
4686Å
is weaker than HeI![]() 4713Å. The objects
are arranged in sequence of increasing HeI line-width
(top-to-bottom). The positions of the classification lines
are indicated
4713Å. The objects
are arranged in sequence of increasing HeI line-width
(top-to-bottom). The positions of the classification lines
are indicated